
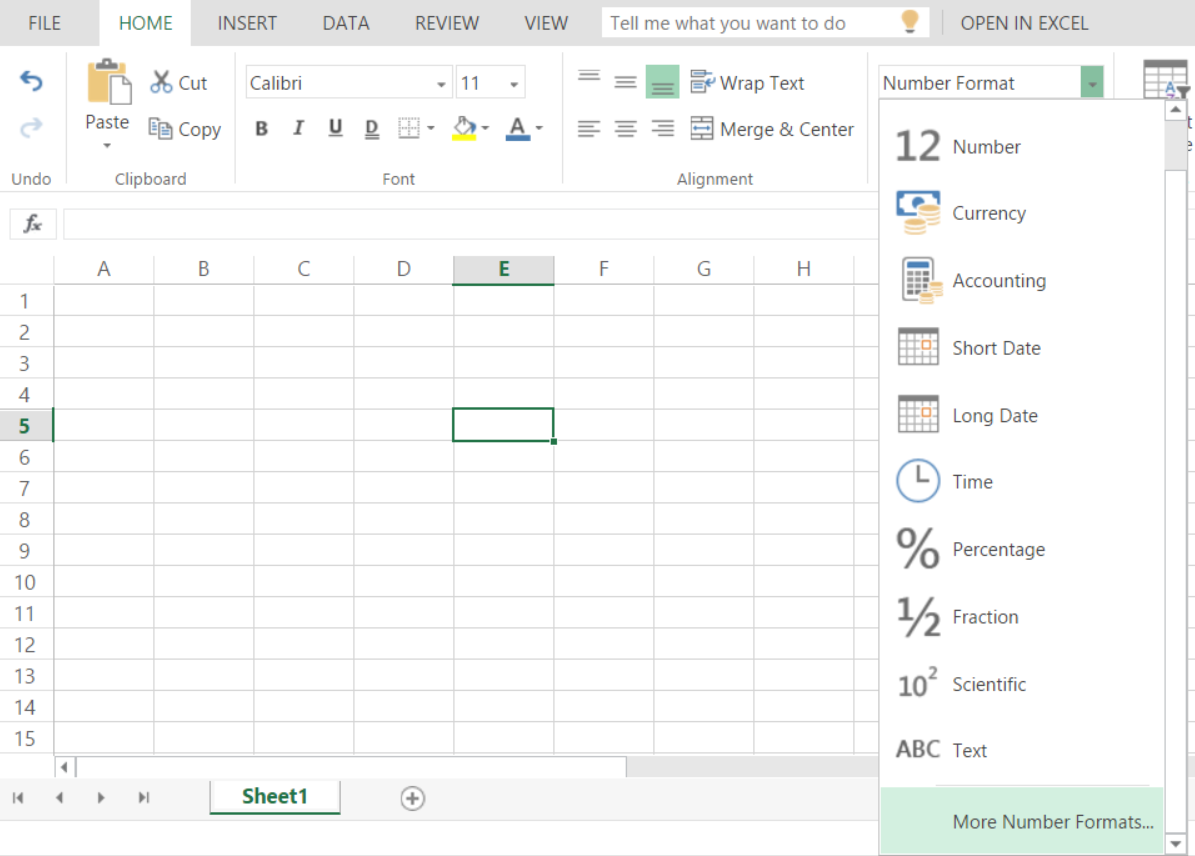
 Free Source Library — exploring the extensive capabilities of Microsoft Excel Online 365 reveals a powerful ecosystem for advanced data analysis, collaboration, automation, and beyond. This comprehensive guide dives deep into its functions, features, and practical applications to equip users with a profound understanding of how to harness its full potential.
Understanding Microsoft Excel Online 365: The Cloud-Based Powerhouse
At its core, Microsoft Excel Online 365 is the cloud-driven evolution of the traditional desktop spreadsheet application. As a component of the broader Microsoft 365 suite, it thrives on accessibility, collaboration, and continuous feature enhancement. Unlike its desktop counterpart, Excel Online emphasizes real-time teamwork, seamless integration with other cloud services, and simplified updates — all without sacrificing core functionalities.
This platform is optimized for diverse environments: from individual freelancers working remotely, to corporate teams managing complex datasets, to educators organizing coursework. Its integration ensures that users can access snapshots of data, perform calculations, and collaborate using virtually any device with an internet connection. Importantly, its web-based nature means no local installation is necessary, removing barriers to entry and fostering a flexible working environment.
Core Mathematical and Statistical Functions: Building Blocks of Data Analysis
Excel Online 365 provides a comprehensive suite of functions that empower users to perform fundamental and advanced mathematical operations. These are essential for analytics, reporting, financial modeling, and everyday calculations. Let’s explore these functions in detail and their strategic applications.
Essential Arithmetic Functions
- SUM(): Calculates the total of a range of numeric values. Vital for aggregations like total sales, total expenses, or cumulative scores. For example, =SUM(B2:B10) sums all figures from cell B2 through B10.
- AVERAGE(): Computes the mean of a dataset, useful for average sales, average temperatures, or student grades. =AVERAGE(C2:C20)
- MAX() and MIN(): Identify the highest and lowest values within a dataset. Critical for performance assessment, such as highest sales or lowest temperature recorded.
Advanced Statistical Functions
| Function | Description | Use Case |
|---|---|---|
| STDEV.P() / STDEV.S() | Calculates standard deviation for entire population (P) or sample (S). | Assessing variability in data, such as stock price fluctuations. |
| COUNT() | Counts cells containing numeric data within a range. | Quantifying the number of data points, like total responses received. |
| VAR.P() / VAR.S() | Variance calculations for population or sample. | Measuring data spread, used in risk analysis. |
Logical Functions: Powering Decision-Making
Logical functions form the decision-making backbone of Excel, enabling automation and dynamic responses within spreadsheets. They facilitate complex workflows that adapt to input data, making spreadsheets intelligent and responsive.
Fundamental Logical Operators and Functions
- IF(): Executes a logical test and returns different results based on the outcome. For example, =IF(A2>100, “Sales High”, “Sales Low”)
- AND() and OR(): Combine multiple conditions. AND() returns TRUE only if all conditions are met; OR() returns TRUE if any condition is true. For example, =IF(AND(B2>50, C2<100), “Eligible”, “Not Eligible”).
- Nested IF()
: Many layered conditions, such as grading systems or categorization.
Applications of Logical Functions
- Automated rejection or approval processes (e.g., credit checks).
- Creating dynamic dashboards that change based on user input.
- Formulating complex decision trees—crucial in financial modeling and operational planning.
Text Manipulation Functions: Organizing and Formatting Data
Text functions are indispensable for cleaning, transforming, and formatting textual data, which is often messy in raw datasets. These functions enable precise control over textual content for reports, labels, IDs, and more.
Core Text Functions in Depth
- CONCATENATE() / CONCAT(): Merges multiple text strings into one. Example: =CONCAT(A2, ” “, B2)
- LEFT(), RIGHT(): Extract specific characters from the beginning or end of a string. Aids in parsing IDs or extracting domain names from email addresses.
- SUBSTITUTE(): Replaces parts of text based on specified criteria. Useful for correcting data or standardizing formats.
- LEN(): Finds the length of text strings, ensuring data consistency or flagging anomalies.
Use Cases and Best Practices
For example, preparing mailing lists requires extracting first names with LEFT() or last names with RIGHT(). Replacing abbreviations or fixing typos involves SUBSTITUTE(). Combining first and last names for full names harnesses CONCAT(). Mastery of these functions supports data integrity and presentation quality.
Lookup and Reference Functions: Connecting the Data Dots
Retrieving data efficiently from large datasets is fundamental for analysis and reporting. Excel’s lookup functions facilitate this with precision and flexibility, often substituting manual searching.
Popular Lookup Functions Explored
- VLOOKUP(): Vertical lookup that searches for a value in the first column and retrieves data from a specified column in the same row.
- HLOOKUP(): Similar to VLOOKUP but searches across the header row, returning data from a specified row.
- INDEX() and MATCH(): A powerful combination that allows for flexible, two-way lookups, and dynamic data retrieval beyond the limitations of VLOOKUP.
Comparative Analysis: VLOOKUP vs. INDEX/MATCH
| Feature | VLOOKUP | INDEX & MATCH |
|---|---|---|
| Flexibility | Less flexible; requires lookup value in first column | More flexible; can search any column or row |
| Performance | Slower with large datasets | Generally faster and more efficient |
| Dynamic Column Referencing | Requires manual adjustment | Automatically adapts with formula adjustments |
Handling Dates and Times in Excel Online 365
Date and time data are crucial for scheduling, tracking, and temporal analysis. Excel’s date and time functions simplify these tasks by providing easy-to-use tools.
Key Date and Time Functions and Their Use Cases
- NOW(): Retrieves the current date and time. Useful for timestamping or real-time calculations.
- TODAY(): Provides only the current date, ideal for daily reports or dashboards.
- DATEDIF(): Calculates the difference between two dates in days, months, or years—helpful in age calculations or project durations.
- NETWORKDAYS(): Counts working days between two dates, excluding weekends and holidays, essential for project planning and payroll calculations.
Applying Date Functions in Real World
Imagine tracking employee tenure, project deadlines, or calculating accrued interest. Chaining these functions enables dynamic, real-time temporal insights, significantly enhancing strategic planning capabilities.
Beyond Basics: Advanced Functionalities and Features
Excel Online 365 is more than just functions; it encompasses advanced features that elevate data handling, analysis, and presentation. Here, we explore some of these features which turn simple spreadsheets into powerful analytical tools.
Power Query: Automating Data Ingestion and Transformation
Power Query acts as an ETL (Extract, Transform, Load) engine embedded within Excel Online 365. It allows users to connect to various external data sources—databases, web services, cloud storage—and automate data cleaning and restructuring workflows. This reduces manual work and minimizes errors in importing data, especially from inconsistent reports or multiple sources.
Power Pivot and Data Modeling
Power Pivot enables the creation of complex data models using relational tables, enabling sophisticated analytics that go beyond simple flat sheets. It supports calculated columns, measures, and relationships, akin to a mini database inside Excel, facilitating in-depth analysis of large datasets.
PivotTables and Data Visualization
PivotTables summarize vast data efficiently, offering dynamic grouping, filtering, and aggregation. Combined with PivotCharts, slicers, and timelines, they support interactive dashboards that help spot trends, outliers, or patterns swiftly. These tools are default in Excel Online or accessible via add-ins, making powerful data storytelling accessible to all users.
Conditional Formatting and Data Validation
Conditional formatting enhances visual cues—highlighting high/low values, duplicates, or specific ranges—thus enabling immediate recognition of anomalies or performance indicators. Data validation enforces data integrity by restricting input values, providing dropdown lists, or setting criteria for data entry, essential for maintaining consistent datasets.
Automation with Macros and VBA
While traditional VBA macros are more limited in Excel Online, the platform supports automation through Office Scripts and Power Automate. These tools enable recording workflows or scripting actions that can be triggered automatically, vastly improving efficiency for repetitive tasks.
What-If Analysis and Scenario Planning
Strategic decision-making benefits immensely from these features. Goal Seek helps find input values to meet specific targets, while Scenario Manager allows testing multiple hypothetical situations—vital in financial forecasts, operational planning, or risk assessments.
Data Visualization: Charts and Beyond
Excel Online offers a broad selection of charts—bar, line, pie, treemap, sunburst—each suitable for varied data stories. The advanced formatting capabilities enable professional, insightful visual representations, making data accessible to stakeholders regardless of their technical background.
Extensibility via Add-ins and Custom Integrations
The platform supports third-party add-ins and custom apps that enhance its core functionalities. Whether adding specialized analytics, data connectors, or integration with other SaaS tools, this extensibility ensures Excel Online remains adaptable to evolving needs.
Collaborative Power: Multitudes Working as One
Excel Online’s paradigm is built around real-time collaboration. Multiple users can co-author documents, see each other’s changes instantly, and communicate through inline comments. Version history ensures that changes are tracked, and previous states can be restored if needed.
Best Practices for Effective Collaboration
- Use comments systematically to clarify changes or ask questions.
- Leverage co-authoring to reduce version conflicts.
- Implement data validation to prevent erroneous entries.
- Establish naming conventions and documentation within workbooks for clarity.
Technical Strategies for Troubleshooting and Optimization
Despite its robustness, users often encounter issues—from slow performance with large datasets to formula errors. Here are strategies to troubleshoot common challenges:
- Managing Large Datasets: Use data models and avoid complex array formulas where possible.
- Formula Troubleshooting: Track circular references, check for #N/A or #VALUE errors, and optimize nested functions.
- Performance Tuning: Limit volatile functions like OFFSET or INDIRECT, and turn off unnecessary add-ins.
- Data Quality: Enforce data validation, standardize inputs, and maintain consistent formats.
Final Advice and Strategic Guides for Mastery
Mastering Excel Online 365 requires a systematic approach:
- Learn the core functions thoroughly, understanding their syntax and best use cases.
- Experiment with real-world datasets to develop practical skills.
- Utilize available resources such as tutorials, Microsoft’s official documentation, and user communities.
- Regularly explore new features and updates to stay ahead.
- Design your spreadsheets with clarity, scalability, and reproducibility in mind.
- Integrate automation and external data sources where applicable for advanced solutions.
Summary: Unleashing the Full Potential of Excel Online 365
Microsoft Excel Online 365 isn’t just a digital spreadsheet tool—it’s a comprehensive platform for data-driven decision-making, automation, and collaboration. Its functionalities span simple calculations to complex data modeling, enabling professionals to streamline workflows, derive insights, and communicate findings effectively. By mastering its extensive functions and features, users unlock the true power of their data, advancing their strategic and operational objectives efficiently.