
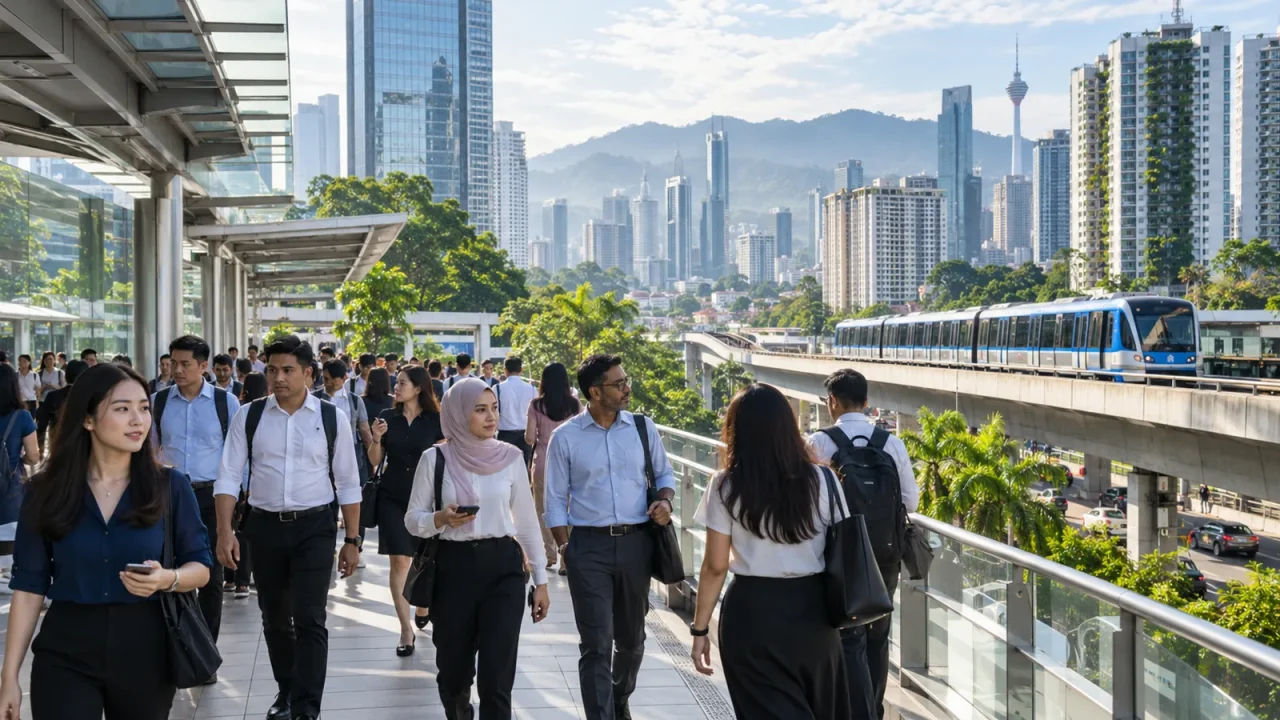
Malaysia’s population is growing more slowly, aging steadily, and distributed very unevenly between highly urbanized western corridors and more rural parts of Sabah, Sarawak, and the peninsula. A single national total cannot show those shifts, but it is the right place to start—provided the year and source are clear.
The Department of Statistics Malaysia (DOSM) estimates the Malaysia population at 34.4 million in mid-2026, up from 34.2 million in 2025. The 2026 figure is preliminary and based on the 2020 Population and Housing Census, updated with births, deaths, internal migration, and international migration. This article replaces the old 2024 snapshot while preserving its permanent URL.
Malaysia in 2026
- Total population: 34.4 million
- Annual growth: 0.5%
- Citizens: 31.0 million, or 90.2%
- Noncitizens: about 3.4 million, or 9.8%
- Median age: 31.7 years
- Age 0–14: 21.2%; age 15–64: 70.4%; age 65+: 8.4%
- Sex ratio: 110 males per 100 females overall
All figures in the summary come from DOSM’s Current Population Estimates, Malaysia, 2026. Rounding means components may not add perfectly to the displayed total.
How the official estimate is produced
A census provides the population base. Between censuses, statisticians update each age and sex cohort using births, deaths, internal migration, and international migration—the cohort-component method. DOSM builds estimates at state level and sums them for the national total.
The 2026 estimate is marked preliminary because newer administrative data can lead to revision. “Estimate” does not mean guess; it means a structured calculation with defined sources and methods. The responsible way to cite it is “DOSM’s preliminary mid-year 2026 estimate,” not an undated claim that Malaysia permanently has exactly 34.4 million people.
Growth has slowed
DOSM reports 0.5% population growth for 2026. Natural increase—the difference between births and deaths—was estimated at 175,119 people and continued to decline because fertility is lower and deaths are increasing as the population grows older.
International migration also affects the total. Citizens grew 0.6%, while the noncitizen population showed a small negative growth rate. Migration estimates are difficult because permit status, temporary presence, cross-border movement, undercount, and administrative definitions all matter.
Citizens and noncitizens
Citizens account for 31.0 million people, 90.2% of the 2026 total. Noncitizens account for roughly 3.4 million, 9.8%. “Noncitizen” is a legal category, not one homogeneous community. It includes people with different occupations, family situations, nationalities, lengths of stay, and documentation.
The national sex ratio is partly influenced by labor migration because some noncitizen worker populations are heavily male. DOSM reports 102 citizen males per 100 citizen females, compared with a much higher ratio among noncitizens. A national average of 110 should not be interpreted as a biological anomaly.
Age structure: still working-age heavy, but aging
People aged 15–64 make up 70.4% of the population, providing a large working-age base. The share aged 0–14 fell from 21.6% in 2025 to 21.2% in 2026. The share aged 65 and older rose from 8.0% to 8.4%, or about 2.9 million people. Median age increased from 31.3 to 31.7.
The change is gradual but consequential. Fewer children affect school enrollment and future labor-force entry. More older adults increase demand for chronic-disease care, accessible housing, pensions, long-term care, and age-friendly transport. A country can have a large working-age majority and still need to plan urgently for aging.
Dependency ratios
DOSM’s total dependency ratio fell slightly to 42.0 dependents for every 100 working-age people. The young-age component declined, while the old-age component rose to 11.9. This statistical ratio does not count actual earners and dependents—many people aged 15–64 are students or not employed, while some older people work—but it provides a broad planning indicator.
Population by sex
The estimate lists 18.0 million males and 16.4 million females. The 110-to-100 overall ratio varies sharply by state, district, citizenship, and age. Districts with male-dominated industries or worker accommodation can have much higher ratios, while several districts have more females.
Sex in official population tables is an administrative demographic variable and should not be used to infer household structure, gender identity, or social equality by itself.
Citizen ethnic-group statistics
For citizens in 2026, DOSM reports Bumiputera at 70.7%, including Malays at 58.4% and other Bumiputera at 12.3%; Chinese at 22.0%; Indians at 6.5%; and others at 0.8%. These are official administrative categories with legal and historical context.
Percentages should not be treated as biological divisions. Each category contains regional, linguistic, religious, cultural, and socioeconomic diversity. They apply to citizens, so adding noncitizens or comparing them with a total-population denominator creates errors.
Regional distribution
Malaysia consists of Peninsular Malaysia and the states of Sabah and Sarawak on Borneo, separated by the South China Sea. Population is concentrated in Peninsular Malaysia, especially the Klang Valley, Johor, and other urban and industrial corridors. Sabah and Sarawak cover large areas with lower average density and distinctive settlement patterns.
State totals hide district differences. DOSM’s 2026 district release identifies Petaling at about 2.4 million, Johor Bahru at 1.8 million, and Ulu Langat at 1.5 million as the most populous administrative districts. These are administrative districts, not exactly the same as city boundaries or built-up urban areas.
Urbanization and metropolitan growth
Malaysia is highly urbanized. Greater Kuala Lumpur extends across multiple local authorities and districts, so “Kuala Lumpur population” can mean the federal territory, the continuous built-up area, or a wider functional metro. The same boundary caution applies to Johor Bahru, George Town, and other conurbations.
Urban growth creates opportunities through jobs, education, and services while raising pressure on housing, transport, flood management, water, waste, and heat. Population density can support efficient transit if land use and infrastructure are coordinated.
Fertility and family formation
Malaysia’s fertility has fallen over decades and is below replacement level nationally. Later marriage, education, urban living, housing cost, work-family balance, access to contraception, and changing preferences all contribute. Rates vary across groups and states.
Low fertility does not create immediate population decline because age structure and migration produce demographic momentum. It first appears as smaller child cohorts, slower natural increase, and gradual aging.
Mortality and life expectancy
Deaths rise in absolute number as a population becomes larger and older even if health improves. Life expectancy and cause-of-death patterns differ by sex, state, ethnicity, income, and access to care. The COVID-19 pandemic also disrupted recent trends.
Population estimates use registered deaths and statistical adjustment, while detailed health analysis should use DOSM mortality and Ministry of Health data rather than inferring health from the total population alone.
Internal migration
People move for study, employment, housing, marriage, and family support. Flows toward Selangor, Kuala Lumpur, Johor, and other growth centers can expand peri-urban districts while some rural or older districts lose younger adults. A state may grow even if natural increase slows because it attracts internal migrants.
Place of usual residence, workplace, birthplace, and legal address are different variables. Daily commuting across state boundaries further complicates daytime service demand.
International migration
Migrant workers are important in manufacturing, construction, agriculture, plantations, services, domestic work, and other sectors. Students, professionals, dependents, refugees, asylum seekers, and people with irregular status add distinct populations that may be counted differently.
Because migration can change rapidly with policy, recruitment, economic conditions, and border controls, noncitizen estimates carry uncertainty. Dehumanizing migrants as merely a balancing number ignores rights and the economic systems that shape movement.
Why projections differ from estimates
An estimate describes a past or current population using observed data. A projection asks what may happen under assumptions about fertility, mortality, and migration. The United Nations World Population Prospects and national projections can differ because they use different base data, adjustments, and scenarios.
Do not present a 2050 projection as a prediction guaranteed to occur. Policy, technology, economic change, climate, health crises, and preferences can alter the path.
Youth, older people, and the policy transition
DOSM estimates 9.5 million people aged 15–30 in 2026, or 27.7% of the population. This remains a large cohort entering higher education, work, housing, and family formation. Whether a demographic dividend materializes depends on job quality, skills, health, productivity, and the ability of women and men to participate—not age structure alone.
At the same time, 4.2 million people are aged 60 or older, 12.3% of the population. The 60-plus and 65-plus measures are both useful but should not be mixed. Planning spans healthy aging, chronic-disease prevention, retirement income, accessible transport, care workers, home modification, and support for family caregivers.
The two priorities are not opposites. Affordable housing, reliable public transport, walkable neighborhoods, preventive healthcare, and digital access can benefit young adults and older people simultaneously. Intergenerational policy is stronger than framing one age group as a burden on another.
Density is local, not national
Dividing 34.4 million people by Malaysia’s land area produces a national average that hides most settlement reality. Dense Petaling and Kuala Lumpur coexist with sparsely populated interiors, mountains, forests, plantations, islands, and large rural districts. State and district density are better for service planning.
DOSM’s district statistics identify Petaling at roughly 4,800 people per square kilometer, while many districts are far below that. High density can support transit and nearby services but can also intensify housing cost, congestion, heat, and flood exposure when infrastructure lags. Low density raises the cost of providing schools, clinics, broadband, and transport across long distances.
How to use Malaysia population data correctly
- State the reference date: mid-year 2026, not simply “current.”
- Identify preliminary versus final data.
- Use the correct denominator for citizen ethnic-group percentages.
- Distinguish state, district, city, and metro boundaries.
- Do not add rounded components and claim the difference is an error.
- Download the latest DOSM release for decisions that depend on precision.
Frequently asked questions
What is Malaysia’s population in 2026?
DOSM’s preliminary mid-year estimate is 34.4 million.
Is Malaysia’s population still growing?
Yes, but slowly: the 2026 annual growth rate is estimated at 0.5%.
Is Malaysia an aging country?
The population is aging: 8.4% are 65 or older and median age is 31.7. The process is ongoing rather than complete.
Which district has the largest population?
DOSM’s 2026 district estimates place Petaling first at about 2.4 million, followed by Johor Bahru and Ulu Langat.
Why does the page URL still include 2024?
The original link is preserved to avoid breaking search results and references. The title and content now use the latest official 2026 release.
Bottom line
Malaysia’s preliminary 2026 population is 34.4 million, with slow 0.5% growth, a large working-age majority, and a rising older population. The national total is only the first layer. Citizenship, migration, state and district geography, urbanization, fertility, and aging explain where the country is heading—and why official definitions matter.
Sources
- Department of Statistics Malaysia: Current Population Estimates, 2026
- OpenDOSM: The Population of Malaysia
- United Nations: World Population Prospects 2024
Data and evidence reviewed: October 16, 2026.