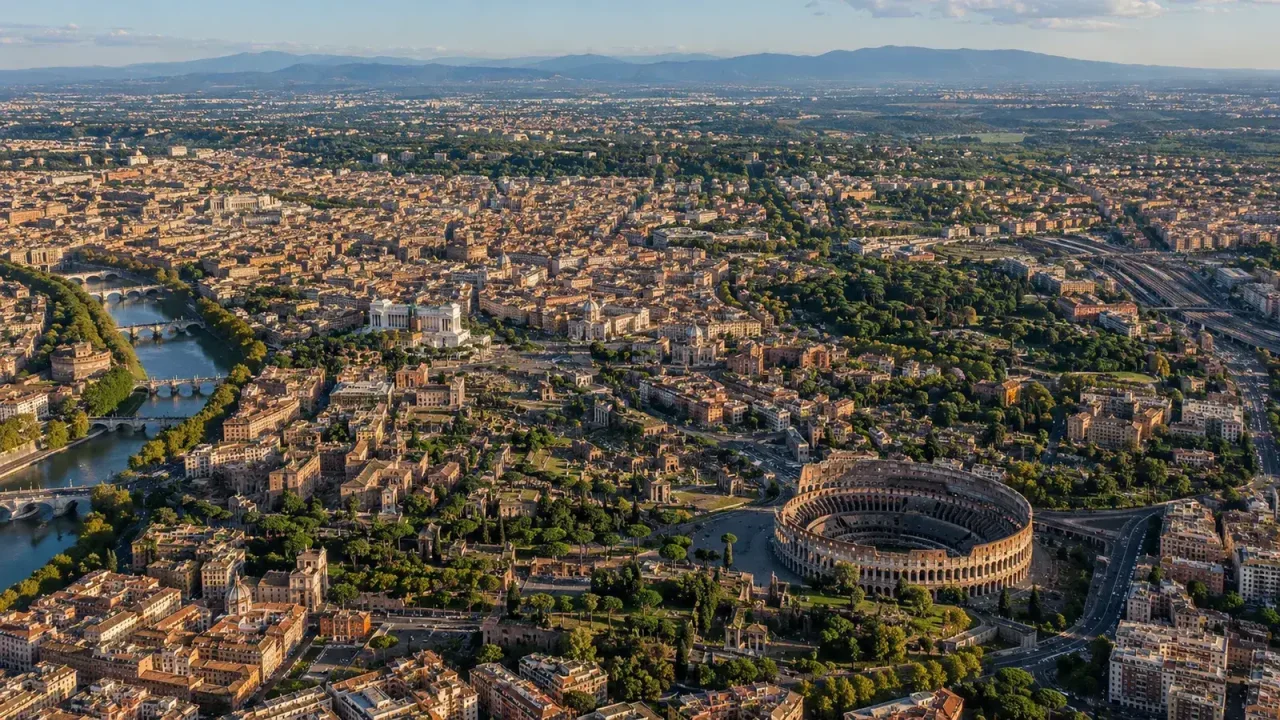
“What is the population of Rome?” sounds like a question with one number. It is actually a boundary question. Rome can mean the historic center, the administrative municipality called Roma Capitale, the Metropolitan City of Rome Capital, the continuously built urban area, or a commuting region. Each boundary produces a different total, and several can be correct at the same time.
This guide explains how to read Rome population statistics rather than copying an undated figure. It identifies the most authoritative sources, shows why city and metro estimates differ, and examines density, migration, age structure, households, and the huge difference between registered residents and people present during the day.
Key takeaways
- Roma Capitale is the municipality and contains roughly 2.8 million registered residents in a very large territory.
- The Metropolitan City includes Rome plus more than 100 surrounding municipalities, so its population is much larger.
- Administrative population, census population, urban-area estimates, and functional-metro estimates measure different things.
- Rome’s average density hides major contrasts between the compact center, postwar districts, and rural or protected land.
- Use Roma Capitale and Istat for official figures, and always record the reference date and boundary.
The number changes when the map changes
Roma Capitale
This is the municipal government of Rome. It covers about 1,285 square kilometers, unusually large for a European capital municipality. Its boundary includes dense central neighborhoods, outer residential districts, archaeological zones, farmland, parks, and the coast at Ostia. A municipal population figure spreads residents across all of that territory.
Metropolitan City of Rome Capital
This administrative body replaced the former Province of Rome. It includes Roma Capitale and many independent municipalities around it. Its population is therefore not the population of “Rome city” even though the names are similar.
Urban area
An urban-area estimate tries to follow continuous built-up settlement rather than legal boundaries. Depending on the method, some outer parts of the municipality may appear less urban while built-up areas beyond the municipal line are included.
Functional urban or metropolitan area
A functional area uses commuting and economic integration. It asks which surrounding municipalities are tied to the urban core through daily travel, employment, and services. It is useful for transport and labor-market planning but does not replace local administrative counts.
What is the current official figure?
Roma Capitale publishes registered-population datasets by municipality, urban zone, and territorial subdivision. Its statistics portal announced data updated to December 31, 2025 in May 2026. Istat, Italy’s national statistical institute, also publishes resident-population and census-based series.
The responsible answer is “about 2.8 million registered residents in Roma Capitale,” followed by the exact source, date, and definition being used. A last digit copied from one table can differ from another because of late registration, census adjustment, reference date, or whether the measure is the municipal registry or usual resident population.
For time-sensitive use—research, policy, journalism, or a business plan—download the current table rather than relying on this rounded summary. Population data are revised; a permanent article should teach readers where the update lives.
Registered population versus census population
The municipal registry records people officially registered as residents. A census estimates usual residence using administrative sources, surveys, and statistical correction. People can move without immediately updating registration, retain an address while living elsewhere, or be missed and later reconciled.
Italy’s permanent census now updates population characteristics regularly rather than waiting for one traditional headcount every ten years. Differences between registry and census are not necessarily evidence that one side is careless; they reflect different systems and correction methods.
A vast municipality creates a misleading average density
Dividing roughly 2.8 million people by about 1,285 square kilometers gives an average a little above 2,000 residents per square kilometer. That is mathematically valid and geographically blunt. Central and semicentral zones can be many times denser, while parts of the Agro Romano and protected areas have sparse settlement.
Comparing Rome’s municipal density with Paris, Barcelona, or London without checking boundary size leads to bad conclusions. A tighter boundary captures mostly continuous city; Rome’s includes extensive nonurban land. Neighborhood or grid-level density is better for housing, transit, and service analysis.
Rome’s 15 municipalities
Roma Capitale is divided into 15 municipi, each with local political and administrative functions. They vary greatly in area, population, age profile, housing, and transport access. Municipio I contains the historic center and major institutions but also tourism pressure and a smaller resident base than some outer municipalities. Municipalities farther east and south contain large residential populations and postwar development.
Citywide averages can hide a district with population growth and young families beside another with aging and decline. For site selection, school planning, health services, or transit, municipal and urban-zone data are more actionable than the city total.
Long-term growth and suburbanization
Rome expanded rapidly after it became Italy’s capital in 1871. National migration, industrial and public-sector employment, housing construction, and the postwar economic boom drove enormous growth. Informal and peripheral development often outpaced infrastructure.
In later decades, growth shifted toward the outer municipality and surrounding towns. Some households moved beyond the municipal boundary for housing while maintaining employment and services in Rome. That can make the core look stable or declining even while the functional urban region remains populous.
Births, deaths, and aging
Like Italy overall, Rome faces low fertility and population aging. In many recent years, deaths exceed births, so migration becomes crucial to maintaining population and workforce size. Aging affects demand for healthcare, accessible transport, home support, and housing design, while smaller younger cohorts affect schools and future labor supply.
Age structure differs across the city. A district with new housing and immigrant families can have more children; a long-established central or affluent area may have older residents and more one-person households. Use age-specific local tables rather than applying the national profile uniformly.
Internal and international migration
Rome attracts students, professionals, public-sector workers, migrants from other Italian regions, and international migrants. It also loses residents to surrounding municipalities, northern Italian labor markets, and other countries. Gross flows can be large even when the net population barely changes.
Foreign citizenship statistics do not capture everyone with a migration background. Naturalized citizens are counted as Italian, second-generation residents may be Italian from birth, and citizenship rules shape categories. Country-of-birth, citizenship, and language answer different questions.
Households and housing
Household size has declined over time, influenced by aging, later partnership, separation, lower fertility, and more people living alone. A stable population can therefore require more dwellings. This matters for rents, energy use, neighborhood services, and the mismatch between large older homes and small households.
Tourist accommodation and short-term rentals add another layer. An apartment can be physically occupied frequently without housing a registered resident. A historic-center street may feel crowded while its resident population falls.
Population, jobs, and unequal access
Rome’s labor market includes national government, municipal services, universities, healthcare, tourism, culture, media, construction, retail, professional services, and technology. Jobs are not distributed in the same pattern as homes. Radial transport networks and limited cross-city links can make two places that look close on a map functionally distant.
Population change therefore has an accessibility dimension. A growing outer district without frequent transit, schools, clinics, and public space does not receive the same urban benefit as a well-served district. Commuting time, not just kilometers, shapes participation in employment and education.
Income, housing tenure, citizenship, age, and disability also affect the ability to remain in a neighborhood. Citywide growth can coexist with displacement in central areas and overcrowding elsewhere. Ethical demographic analysis connects totals to who can access housing and services rather than treating residents as interchangeable units.
Infrastructure follows more than the resident count
Water demand, waste collection, road use, public transport, emergency planning, and heat adaptation depend on resident location plus commuters and visitors. Historic infrastructure may be constrained by archaeology, narrow streets, and protected fabric, while peripheral growth requires new networks across large distances.
Climate risk also changes population planning. Older residents are more vulnerable during heat waves, and sparsely shaded districts may face greater exposure. Flood risk, coastal conditions near Ostia, and wildfire at the rural-urban edge require neighborhood-scale population data. A single municipal density cannot guide these decisions.
Daytime population: commuters, students, and visitors
Registered residents are only one part of Rome’s daily load. Commuters enter for work and education, patients use major hospitals, and visitors arrive for tourism, government, business, religion, and culture. Major events can add large temporary crowds.
Transport, sanitation, policing, water, and public-space planning must consider people present, not just people sleeping at registered addresses. Mobile-device and transport data can estimate flows, but privacy, representativeness, and proprietary methods require scrutiny.
Tourism does not equal population
Overnight stays, hotel arrivals, airport passengers, and attraction tickets are flow measures. Adding them to the resident total makes no demographic sense because a single visitor may appear in several datasets, and annual totals count visits rather than simultaneous people.
A useful tourism measure states units: arrivals, nights, average stay, occupancy, or estimated people present on a given day. Avoid headlines that compare annual visitor entries directly with residents.
Rome and Vatican City
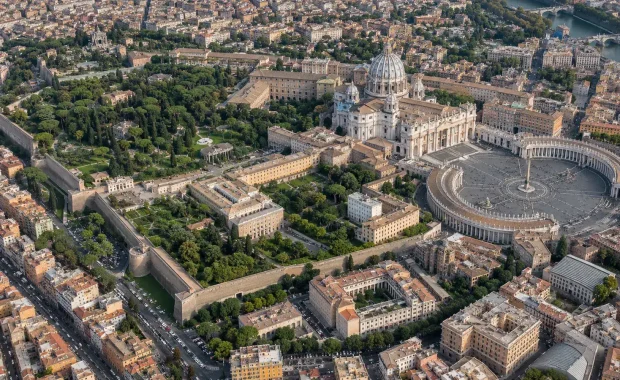
Vatican City is a sovereign state inside Rome, not a neighborhood counted as part of Roma Capitale’s resident population. Its tiny resident count does not materially change metropolitan totals, but pilgrims and Vatican employees contribute to daily flows around the center.
Some Holy See properties in Rome have extraterritorial status under treaty arrangements. Legal status does not mean they form ordinary residential extensions of Vatican City for city-population statistics.
How to compare Rome with another city
- Choose the same unit: municipality with municipality, functional area with functional area.
- Use the same reference year.
- Check land area and whether water, parks, or rural land are included.
- Separate resident population from daytime or visitor flows.
- Use density at a comparable spatial scale.
- Record whether figures are registry, census, or modeled estimates.
A ranking without these checks may say more about administrative boundaries than urban life.
Where to find reliable data
Roma Capitale’s statistical portal provides local registered-population tables and an annual statistical yearbook. Istat provides official demographic balances, census data, age and sex structure, households, citizenship, mortality, and geographic definitions. Eurostat and OECD can support comparable urban indicators when their boundary definitions are followed.
Save the table, release date, variable definition, and geographic code. A screenshot of a number without metadata becomes hard to verify when the dashboard updates.
Frequently asked questions
Does Rome have 2.8 million or more than 4 million people?
Both can appear because roughly 2.8 million refers to the municipality, while totals above 4 million usually refer to the wider metropolitan administrative or functional area.
Is Rome one of Europe’s densest cities?
Not by average municipal density, because its boundary is exceptionally large and includes rural land. Some neighborhoods are very dense.
Why did the old article say 2024?
Population releases are dated snapshots. This updated page keeps the permanent URL but directs readers to the latest official tables and explains the measure rather than freezing the title to one year.
Are tourists counted as residents?
No. Visitors are measured in tourism and mobility statistics, not the usual resident population.
Bottom line
Rome’s population is not one timeless number. Roma Capitale has about 2.8 million registered residents, while wider metropolitan definitions contain substantially more people. The right figure depends on the boundary and purpose. Cite the reference date, use official Roma Capitale or Istat data, and compare like with like.
Sources
- Roma Capitale: Official statistical data
- Roma Capitale: Population analysis and datasets
- Istat: Demographic statistics portal
Data and evidence reviewed: October 16, 2026.